Original author: Ding HAN, Alice Kohn
Original source: Glassnode
executive Summary
Since October last year, our altcoin momentum indicator has shown a growing appetite among investors to move capital further up the risk curve.
While Bitcoin’s dominance remains significant, we are already seeing early signs of more capital starting to move into the Ethereum, Solana, Polkadot, and Cosmos ecosystems.
Surveying the Uniswap liquidity pool, we can see that the majority of capital remains in the most mature assets, and while total value locked (TVL) is moving outside the risk curve, trading volume is slower to follow.
Anticipating “Altcoin Season”
A bull run in the digital asset space may have begun as a new spot Bitcoin exchange-traded fund (ETF) gains momentum. Against this backdrop, we continue to explore the question of whether capital will flow into altcoins as we covered in our Week 4 on-chain report. This issue will focus on the performance of assets further up the risk curve.
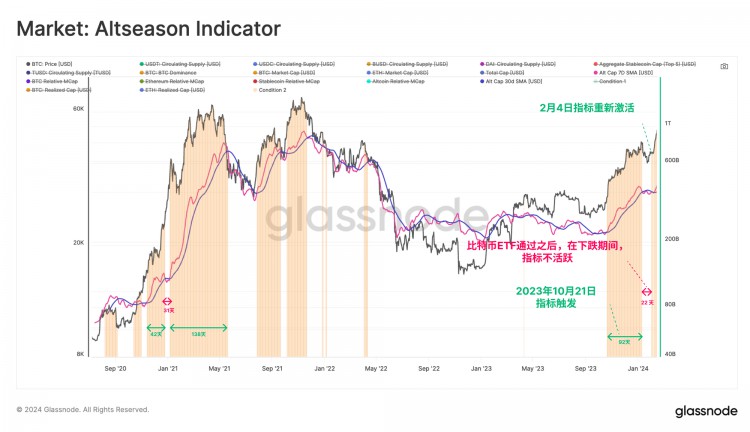
The goal of assessing how capital rotates and flows in the altcoin market. We will once again use our altcoin indicator as a macro indicator (see Weekly Report for Week 41, 2023). This metric assesses whether positive momentum is building within the total exchange coin market cap, accompanied by continued inflows into Bitcoin, Ethereum, and stablecoins.
Our altcoin indicator has been showing positive momentum since October last year, despite a brief pause during the “sell news” event following the Bitcoin ETF approval. It retriggered on February 4th.
 real time chart
In terms of market capitalization, Bitcoin continues to lead the total market capitalization of the entire digital asset market with a market share of more than 52%. In comparison, Ethereum accounts for 17%, stablecoins account for 7%, and the remaining altcoins account for 24%.
 In terms of asset performance, BTC and ETH lead the way, with year-to-date (YTD) increases of +17.6% and +18.2% respectively. We note that after the Bitcoin ETF was approved, ETH began to outperform BTC, a change from its relative underperformance since 2023.
Overall, however, altcoin market capitalization has underperformed, with year-to-date growth less than half that of the two major currencies.
 real time chart
Another way to track performance is to use each industry’s realized market capitalization, which aggregates the cost basis value of all coins moved on-chain. From this order, we can better assess the flow of capital within the digital asset market.
Bitcoin is once again the clear leader, currently seeing almost $20 billion in monthly inflows.
Ethereum's inflows tend to lag relatively behind Bitcoin's, a sign that investors are seeking confidence and confirmation that the digital asset market is growing. In the 2021 cycle, the peak of new capital inflows into BTC occurred 20 days before the peak inflows into ETH.
Altcoins tend to see capital flows with a similar lag after ETH shows strength, with 46 days in mid-2021 and 14 days in late 2021.
Capital flows to altcoins have apparently been slower than the rotation between the two major cryptocurrencies, a trend that appears to be playing out again.
 Industry rotation
With signs of capital flowing into the two major currencies, the next question is to see how it moves further up the risk curve over time. During the last cycle, several new layer-1 ecosystems emerged. Many of these ecosystems compete with Ethereum not only in terms of innovation and attracting users, but also in terms of investment capital.
Therefore, we examined the top five coins of some selected ecosystems: Ethereum, Cosmos, Polkadot, and Solana, to assess which ones are attracting the most investor interest.
Here we compare the weekly changes in the total market capitalization of the top five tokens in each ecosystem. Over the past 18 months, Solana has exhibited relatively high volatility, particularly on the upside. Polkadot and Cosmos have similar volatility, but the Polkadot ecosystem performs better than the latter.
 Within the Ethereum ecosystem, we can specify three main areas: DeFi, GameFi and staking. All three industries have seen capital inflows since the beginning of the year, however the DeFi and GameFi industries have been experiencing relatively large capital outflows in 2022 and 2023.
The GameFi space has seen a reversal this year, with significant inflows starting in October, coinciding with the timing of our altcoin indicator triggering. In contrast, staked tokens have been experiencing positive capital inflows, albeit smaller in absolute terms.
 Move on the risk curve
To determine whether and to what extent investor interest has shifted outside the risk curve, we can refer to data from the Uniswap liquidity pool. Since altcoins are typically traded via decentralized exchanges by more crypto-native traders, activity on the earliest established DEXs can serve as a proxy for altcoin trading trends (note: this data reflects Uniswap trading on the Ethereum mainnet).
Altcoin trading interest was very low during the 2022 bear market, but began to increase in mid-2023, driven primarily by the “meme coin madness” trend. Currently, altcoin trading accounts for nearly 12% of Uniswap’s trading volume, which is close to the 17.4% at the peak of the last bull market. In comparison, WBTC and WETH transactions accounted for 47% of trading volume, and stablecoins accounted for 40%.
 Liquidity providers on Uniswap tend to monitor the market closely, and changes in the distribution of liquidity across pools can provide an indication of market trends. By examining the composition of total value locked (TVL) on Uniswap, we observe increased liquidity allocations to tokens outside of the top 50 during alt season. This trend indicates growing investor interest in long-tail coins.
During a bear market, liquidity is primarily provided for the top 50 coins, as this is where most trading volume occurs. The top 10 tokens are mainly composed of WETH, WBTC and stablecoins.
By looking at the TVL percentage change for each token category, we can detect an increase in liquidity provided for the top 10 (5.14%) and top 20 (10.9%) tokens, while tokens ranked 20 to 50 were removed liquidity. This suggests that market demand for long-tail assets has not yet grown significantly.
 We will now examine the liquidity pools of the top coins in various areas of Ethereum. This includes assessing the distribution of liquidity across price ranges and observing the evolution of market depth (similar to the assumptions we established in Week 36 of the Chain Report).
The distribution between altcoins and WETH reserves is relatively balanced, with expected upside volatility overall being slightly higher. This suggests that liquidity providers generally have a bullish view on these tokens. GameFi token IMX is an exception.
When looking at the rate of change in the liquidity distribution, we see an increase in market depth in the -5% and +5% ranges, indicating that liquidity providers are preparing for a period of greater price volatility.
UNI is an exception, with market makers increasingly concentrating liquidity around the current price range. This suggests that the UNI token is expected to experience less price volatility, which is not surprising given that it is one of the most mature and stable coins. Now comparing this to trader behavior, we can observe an increase in Uniswap trading volume since October 2023, including for coins outside the top 10.

 Contrary to this is the behavior of traders, we can observe an increase in trading volume on Uniswap since October 2023, including coins outside the Top 10. Trading activity among the top 10 to 20 token pairs is also on the rise.
However, the top 20-50 token pairs as well as the top 50+ trading activity remained unchanged, which once again validates our previous hypothesis. While liquidity provision is moving toward a higher risk curve, trading volumes have not yet caught up.
Summary and conclusion
Market momentum for new Bitcoin ETFs and expectations for a bull run in the digital asset are beginning to cause a shift in capital flows toward altcoins. Our altcoin indicators suggest that the altcoin market is likely to see a more mature and potentially sustained rally, but currently remains relatively concentrated in higher market cap assets.
The digital asset landscape has changed significantly over the past cycle, with new ecosystems emerging to challenge Ethereum’s dominance. Solana has been the strongest performer over the past year, but there is also activity within the Polkadot and Cosmos ecosystems. Within the Ethereum ecosystem, the top tokens in the staking space have shown the most consistent capital inflows.
The resurgence of altcoin trading on Uniswap, along with liquidity and volume patterns, underscores the increasingly cautious and growing interest in long-tail assets. This initially manifested itself in changing liquidity provision and expectations of high volatility. However, this exists especially within the TVL of the pool, where investor trading volumes have yet to follow suit.